We’ve all been there at some point in our lives, and everyday we see dozens of learner drivers slowly chugging along trying to get to grips with the road.

But it turns out some UK regions have a knack of breeding better learners than others. After hearing about nightmare test routes and complex junctions we decided to do some research to discover which region has the most skilled learner drivers.

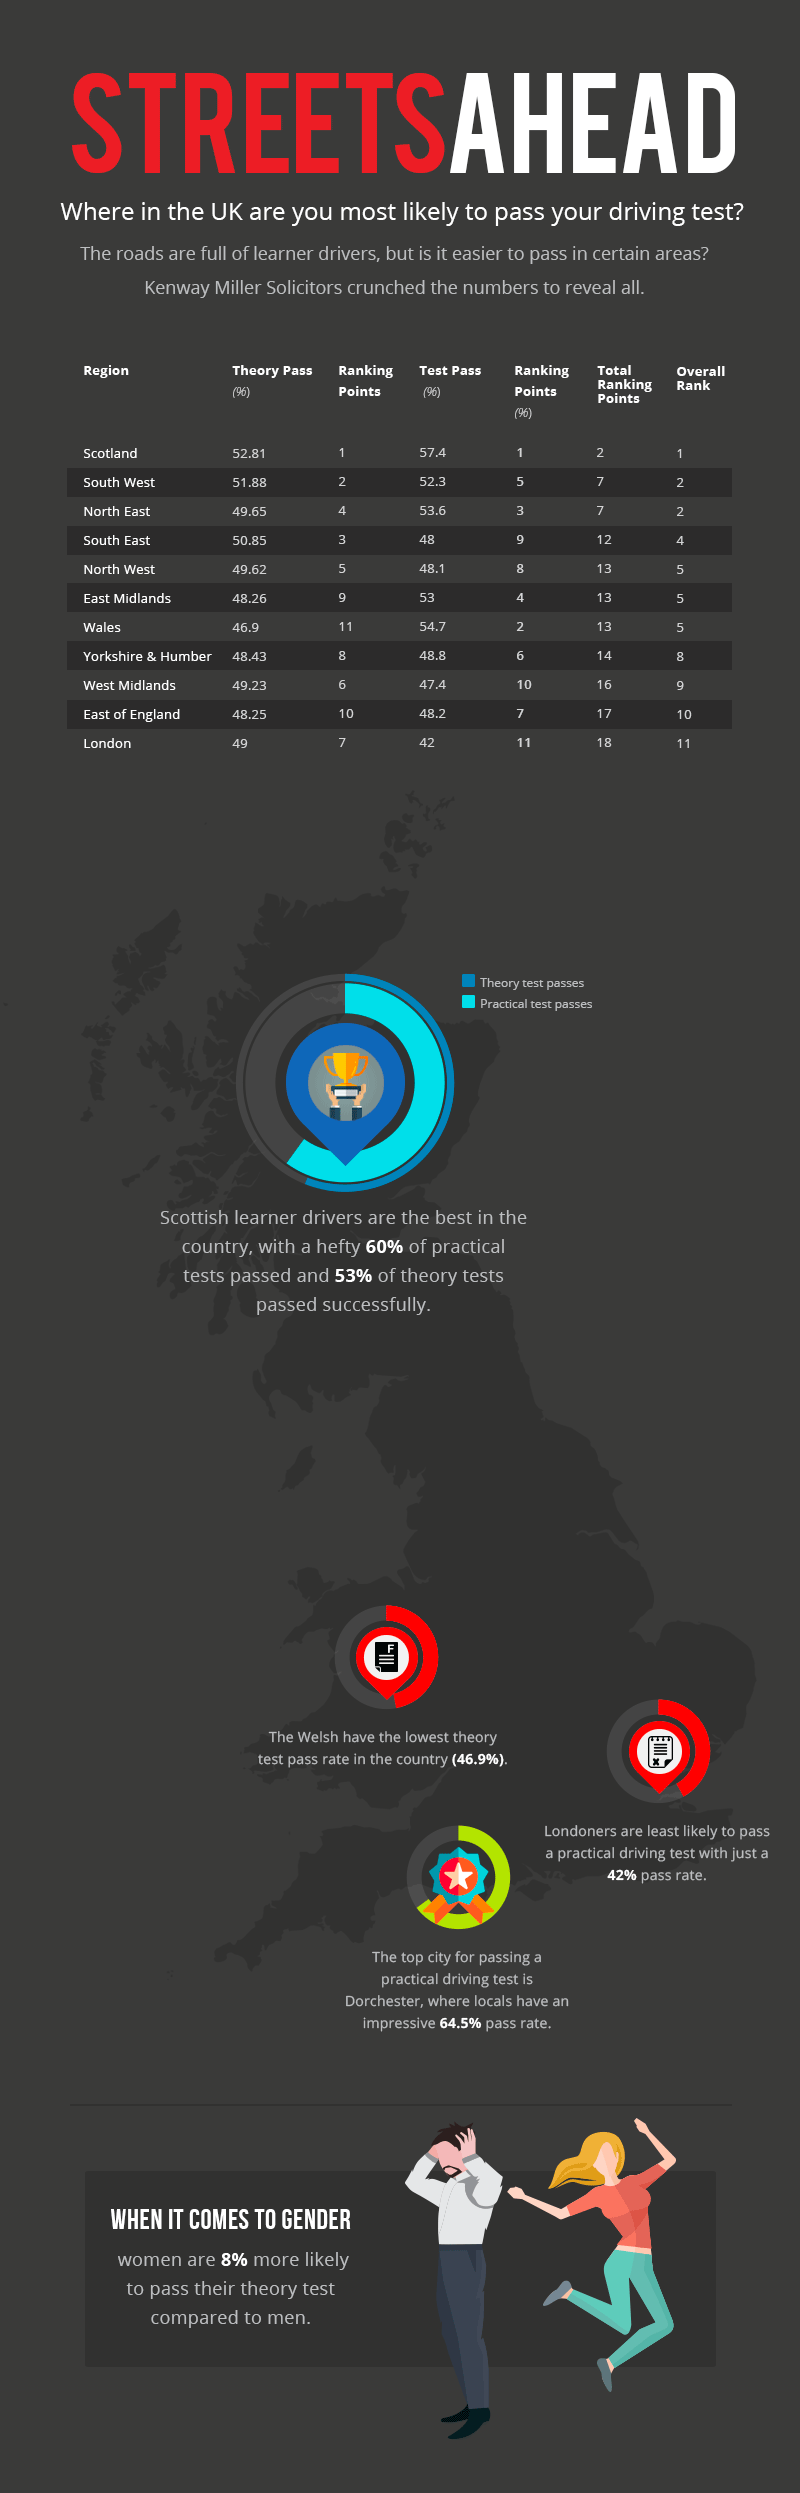
Analysing both theory and practical test results from across the UK, we’ve uncovered the regions with the highest pass rates and ranked them in order of the best places to learn to drive…

Scotland has the best learner drivers. Infographic and data

How The Results Were Calculated

The results are based on DVLA statistics with the regional results based on both the Theory and Practical test. Each region was given a position of one to 11 for both Theory and Practical. Those positions were then added together to give an overall score. The regions were then ranked with the lowest scoring areas having the best learner drivers, and the highest scoring regions having the worst.

All results are taken from testing centres that have had over 1,000 tests taken there across a year.

The Top 10s

You can view the full set of top 10 results below:

Top 10 Regions:

RankRegionPractical Pass %Theory Pass %
1Scotland57.452.81
2South West52.351.88
3North East53.649.65
4South East4850.85
5North West48.149.62
6East Midlands5348.26
7Wales54.746.9
8Yorkshire & Humber48.848.43
9West Midlands47.449.23
10East of England48.248.25
11London4249

Gender Breakdown:

GenderTheory Pass %Practical Pass %Total Theory TestsTotal Theory PassesTotal Practical TestsTotal Practical Passes
Male47.5150.548676423125819709399515
Female51.4143.6446689924003222105096352
Total49.4246.84953663471290418143195867

Highest Practical Pass Rates by City & Gender:

RankTown/CityGenderPass Rate (%)
1IpswichMale65.8
2DorchesterMale65
3DorchesterFemale64.1
4DurhamMale63.3
5Burton upon TrentMale63.1
6AshfieldMale62.6
7Lee On The SolentMale62
8YeovilMale61.8
9WorksopMale61.6
10FarnboroughMale61.4

Highest Theory Pass Rates by City & Gender:

RankTown/CityGenderPass Rate (%)
1GuildfordFemale59.1
1CheltenhamFemale58.6
3ExeterFemale58.5
4InvernessFemale58
5HarrogateFemale58
6CambridgeFemale58
7YorkFemale57.8
8EdinburghFemale57.8
9BrightonFemale57.7

Lowest Practical Pass Rates by City & Gender:

RankTown/CityGenderPass Rate (%)
1ErithFemale29.1
2Cheetham HillFemale30
3WansteadFemale30.1
4ErithMale30.9
5LutonFemale31.2
6WednesburyFemale31.6
7BelvedereFemale31.7
8ChingfordFemale32.1
9BarkingFemale32.4
10BarnetFemale32.8

Lowest Theory Pass Rates by City & Gender:

RankTown/CityGenderPass Rate (%)
1Kings LynnMale41.5
2BradfordMale41.6
3BostonMale42.4
4OldhamMale42.5
5LowestoftMale42.7
6BirminghamMale42.7
7LeicesterMale43
8HaverfordwestMale43.2
9IlfordMale43.3
10ScarboroughMale43.3

Best Practical Test Pass Rates by City:

Town/CityPass %
Dorchester64.5
Ipswich60.4
Chorley59.4
Durham59.3
Yeovil59.2
Farnborough58.5
Burton on Trent58.1
Hyde57.8
Aberdeen57.5
Worksop57.0

Worst Practical Pass Rates by City:

Town/CityPass %
Erith29.8
Cheetham Hill32.7
Wanstead33.4
Belvedere34.8
Basildon35.0
Luton35.0
Chingford35.1
Barnet35.3
Enfield36.5
Barking36.5

Best Theory Pass Rates by City:

Town/CityPass %
Guildford56.4
Cheltenham56.1
Exeter55.7
Cambridge55.7
Edinburgh55.7
Harrogate55
Aberdeen54.9
Inverness54.6
Brighton54.5
Southwark53.9

Worst Theory Pass Rates by City:

CityPass %
Bradford42.9
Lowestoft43.3
Ilford44.2
Birmingham44.3
Oldham44.3
Rhyl44.4
Boston44.6
Leicester44.7
Kings Lynn44.7
Uxbridge44.8