
Pollution and the environment are forever at the forefront of the news. There’s also no escaping the fact that, for the vast majority of us, we rely on our cars.
Whether that be to run the kids to school, pick up the shopping, or commute to work, we need to get around. However, there is more we can do to reduce our footprint on the world.
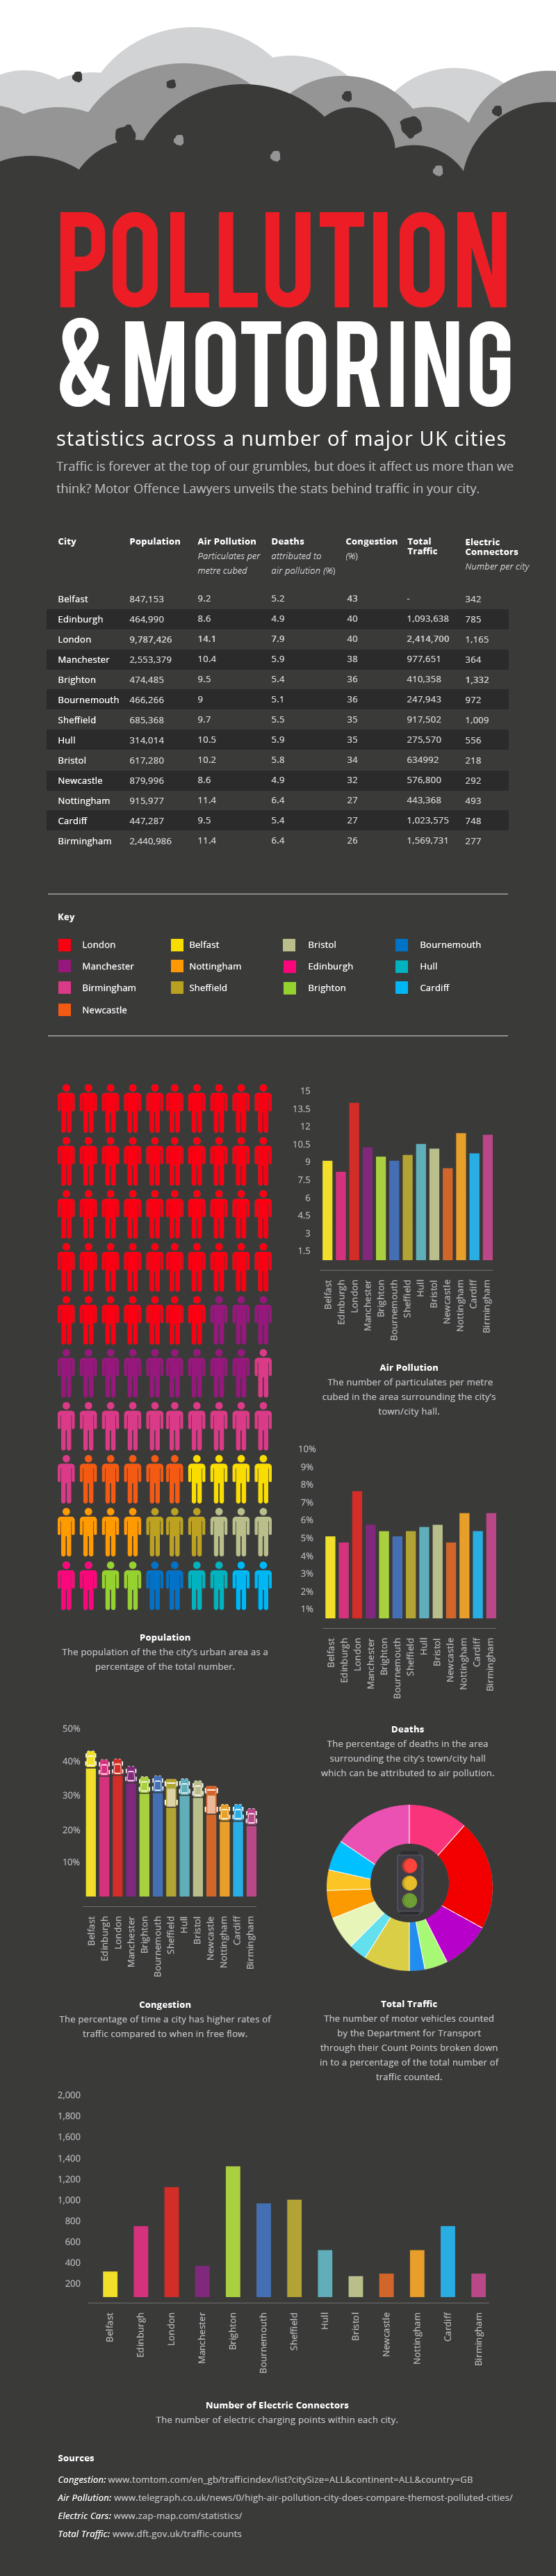
We’ve analysed motoring trends across the UK’s most congested cities to discover how they’re contributing to the environment. The infographic below highlights just how city centre traffic is affecting life in each city.
Key:
- Population: The population of the the city’s urban area
- Air Pollution: The number of particulates per metre cubed in the area surrounding the city’s town/city hall.
- Deaths Attributed to Air Pollution: The percentage of deaths in the area surrounding the city’s town/city hall which can be attributed to air pollution.
- Congestion: The percentage of time a city has higher rates of traffic compared to when in free flow.
- Total Traffic: The number of motor vehicles counted by the Department for Transport through their Count Points
- No. of Electric Connectors: The number of electric charging points within the city.
The UK’s Greenest Drivers Ranked:
- Bournemouth
- Brighton
- Newcastle
- Edinburgh
- Cardiff
- Sheffield
- Belfast
- Nottingham
- Hull
- Manchester
- Bristol
- London
- Birmingham
How it Works
Rankings are based on each statistic being ranked from one to 10. Traffic is measured by taking into consideration population, while the number of people per electric connector is also factored into the above rankings.
